Summary

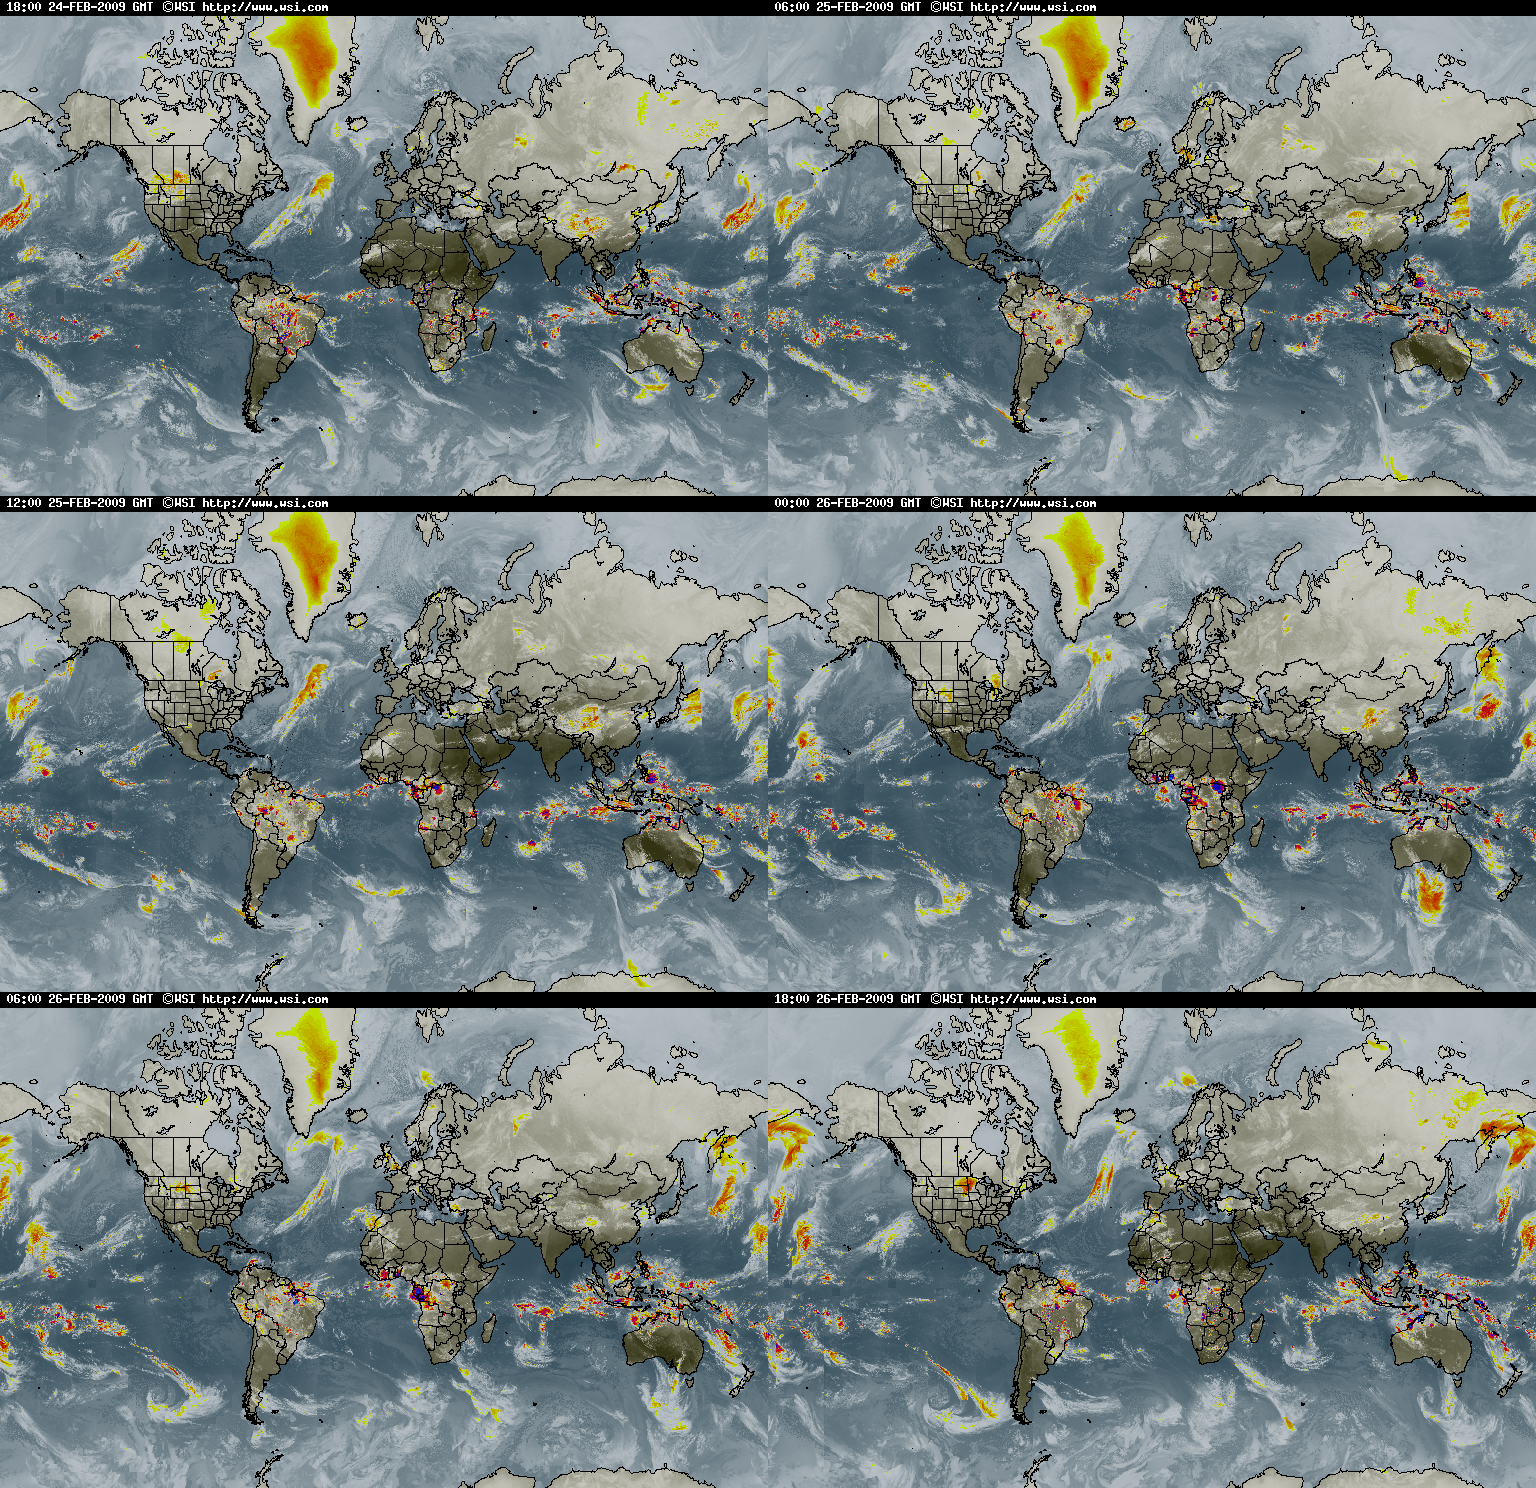
The purpose of this project was to analyze worldwide weather data and to discern any correlative trends in relation to latitude. To complete this task, data was pulled from the OpenWeatherMap API, resulting in a dataset of over 500 cities.
Once the data was extracted, Matplotlib was used to plot various aspects of the data against latitude. Factors that were analyzed included: temperature, cloudiness, wind speed, and humidity. This site provides the source data as well as all visualizations that were created as part of the analyses. Additionally, observations and subsquent conclusions are included to complete the project.