There are three major sections to the parts project. These parts include: an ETL pipeline, a ML pipeline, and a web application that demonstrates the model's efficacy in real time using the user's input. The pipelines used Python libraries Pandas, Numpy, scikit-learn, nltk, and SQLAlchemy. The front-end utilized Flask and plotly.js.
Generated a predictive model for heart disease using labeled data. The data were analyzed, visualized, and modeled using Python libraries Pandas, Seaborn, and scikit-learn. The findings were summarized in a Medium blog.
Implemented a ML model on data to predict outcome of the 2019 World Series. Back-end completed with Python libraries pandas, NumPy, and scikit-learn.
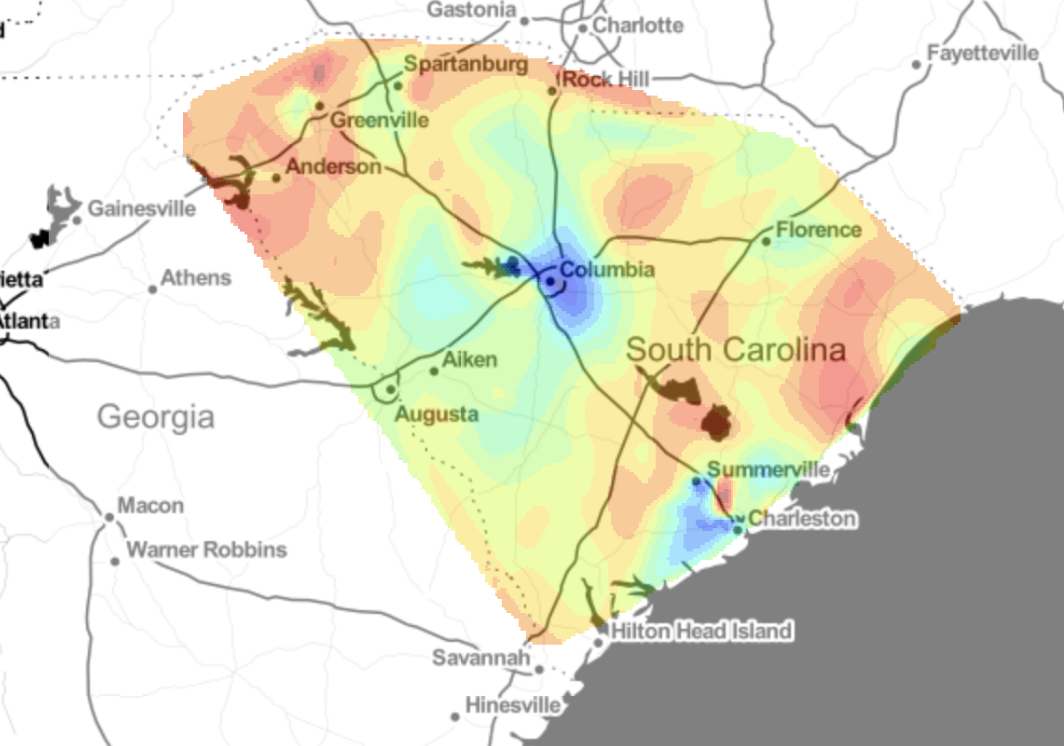
Built a Python application to determine the best areas for property investment in South Carolina using available APIs, and web scraping for rental/property values. Results were graphed in a zoom-able heat-map with Matplotlib.
Generated a web app that visualizes data on bacteria found in various belly-button swabs. Data analysis was performed using Python libraries pandas, NumPy, and SQLAlchemy; the web app was built using Plotly.
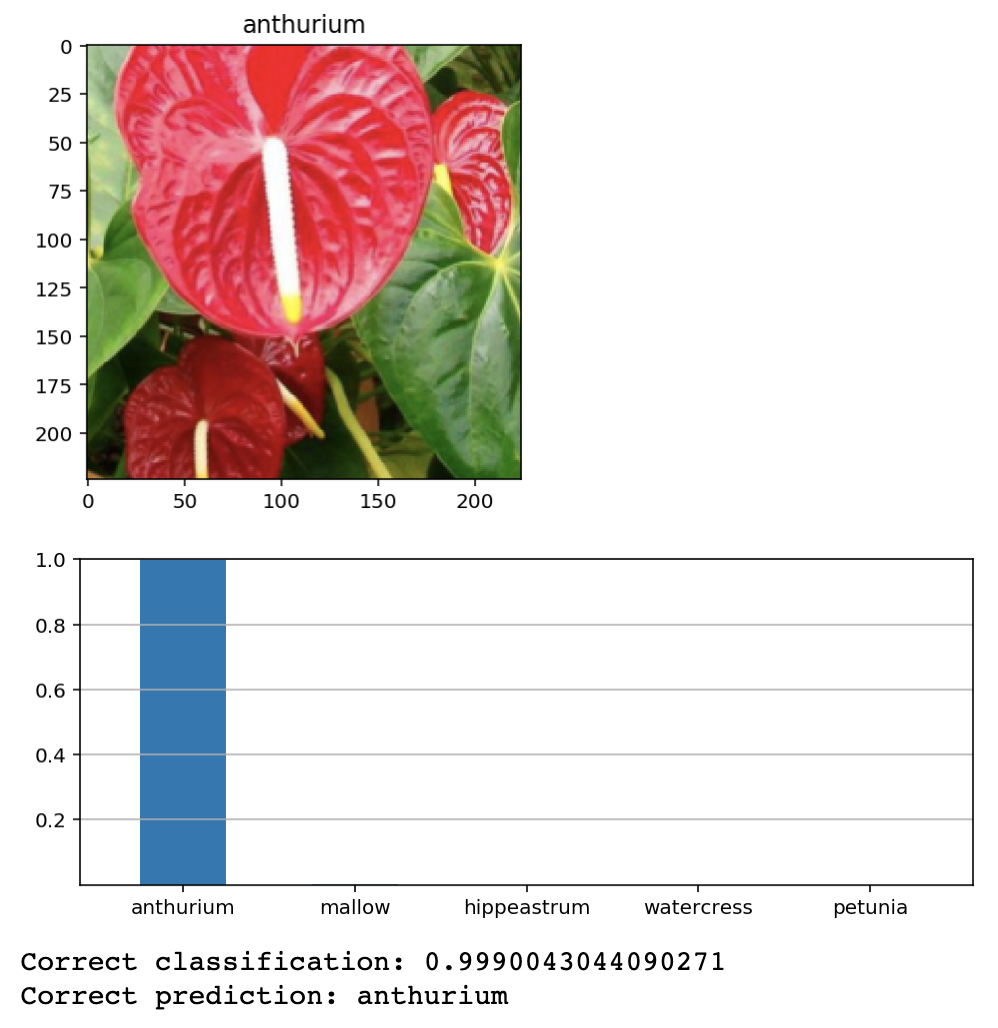
Built a ML model using PyTorch to recognize different species of flowers. The model utilized a pre-trained network and was trained/validated using labeled data.
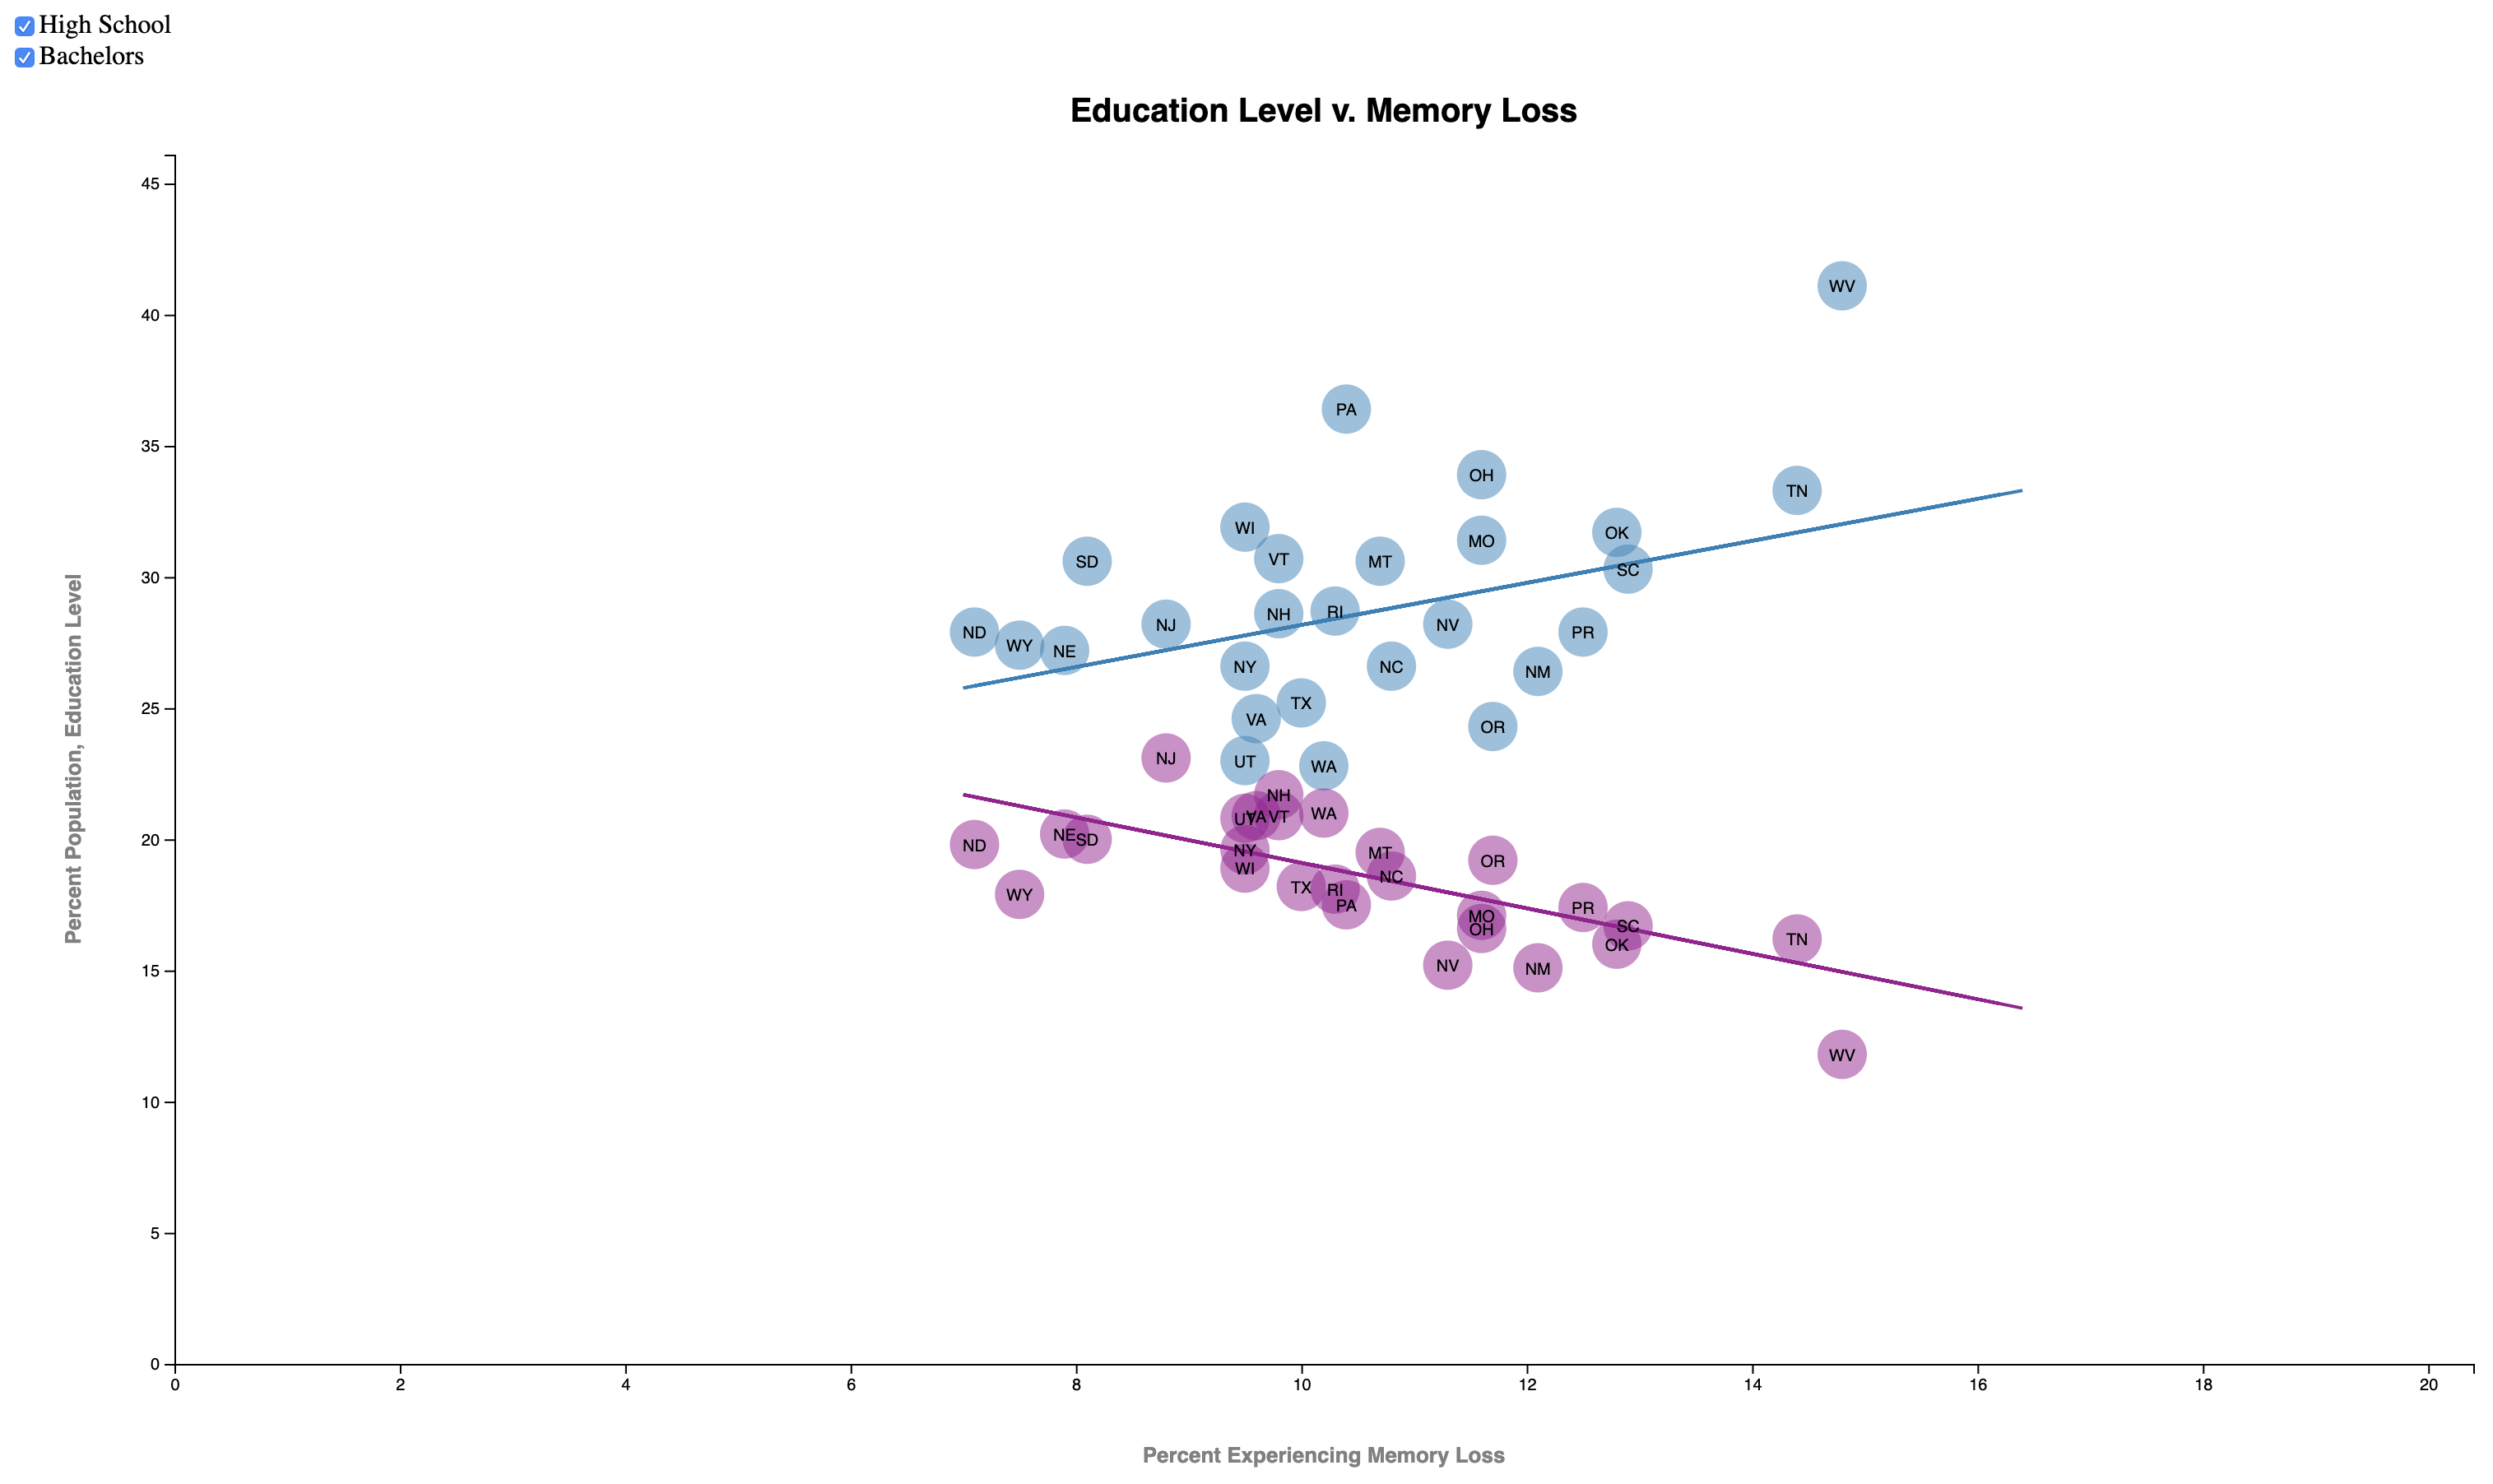
Generated a D3.js visualization of data obtained from US Census and Behavioral Risk Factor Surveillance System. The data were cleaned using Pandas.
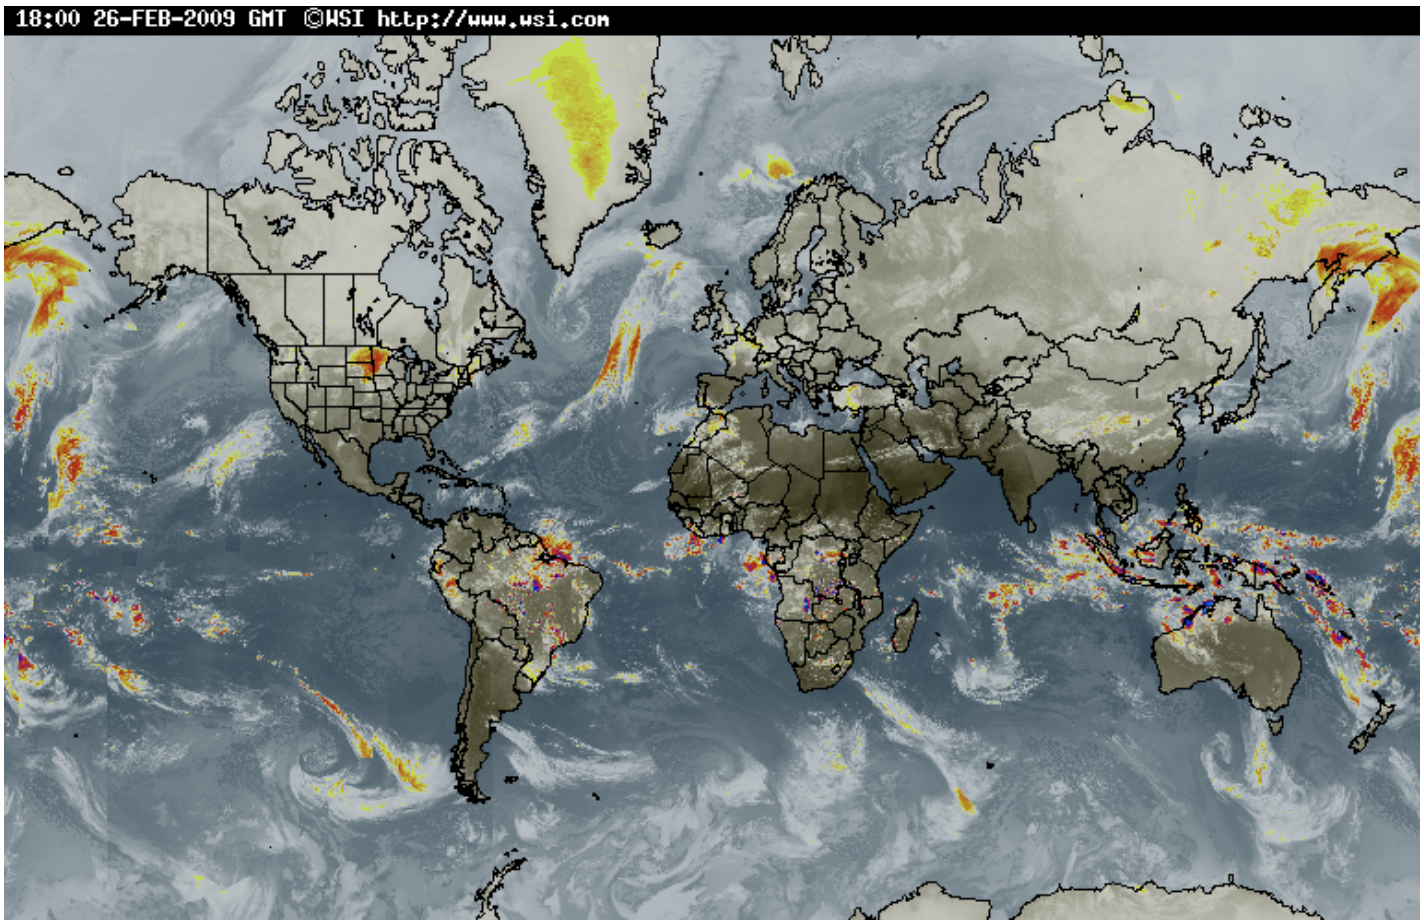
Generated a web page that uses CSS and Bootstrap to display data; the data were obtained from OpenWeatherMap, analyzed using Pandas, and visualized using Matplotlib.
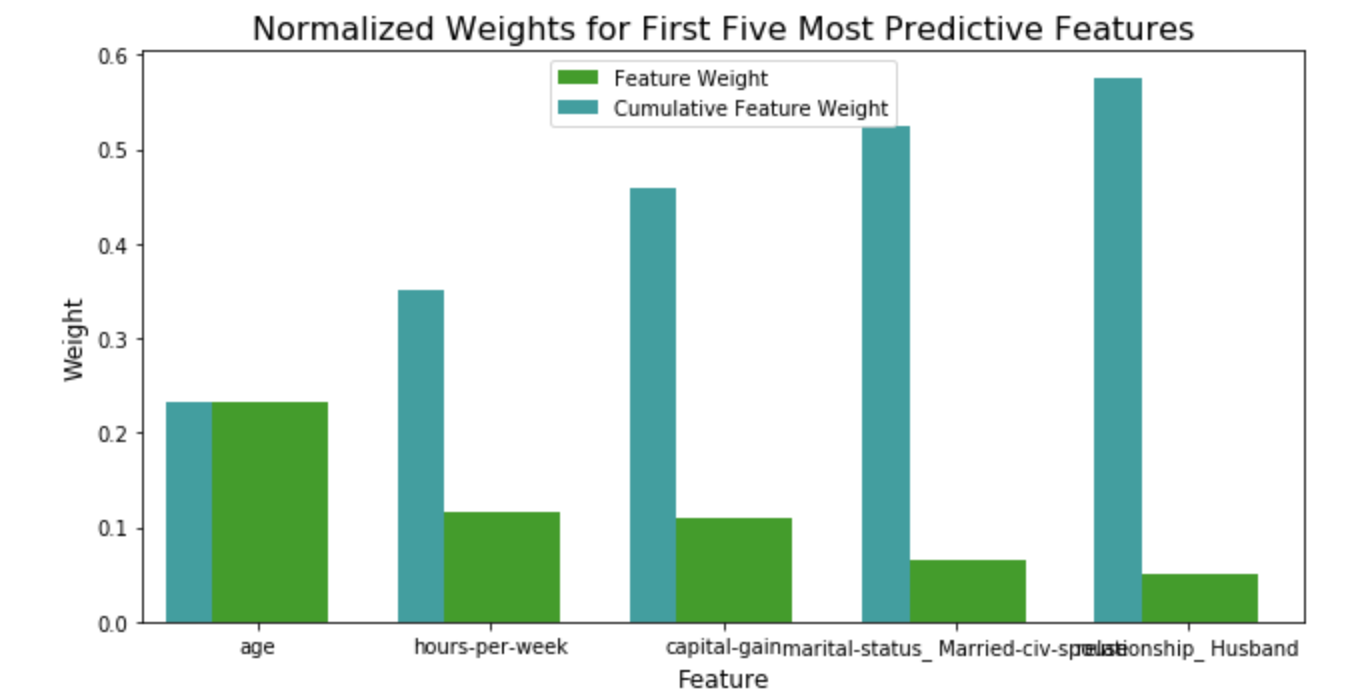
Built a predictive model for finding appropriate donors using labeled data. The data were analyzed, visualized, and modeled using Python libraries Pandas, Matplotlib, and scikit-learn.
A collection of MiniProjects that focus on data analysis and visualization.